So it’s a Monday morning, and you’re in tears.
Tears because goddamn interest rates are so high.
More than 5%?!
Yikes.
What happened to the less-than-2% interest rates that we’re used to?
But hold on, sub-2% interest rates aren’t actually the norm.
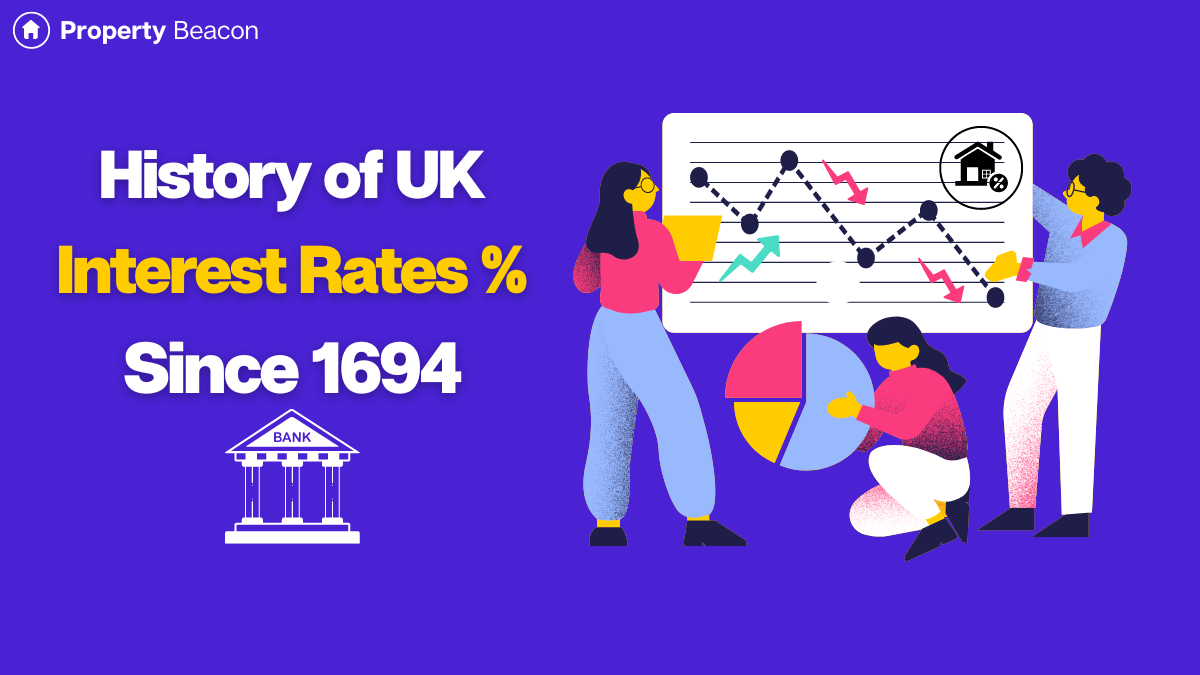
Let’s take a very brief dive into the history of interest rates in the UK.
Long-Term Averages For UK Interest Rates
To get started, here’s a quick summary table of historical interest rates in the UK.
")
You can see from the base rate summary table above, that over the long run, the average interest rate in the UK is above 5%.
In fact,
- Over the last 50 years, the average is around 9.1%
- Over the last 100 years, the average is around 8.3%
- Since 1694 the average is around 5.9%
UK Interest Rates History – 20 Years
If you go back 20 years to 2003, the highest interest rate is 5.75% in 2007, and the lowest interest rate is 0.10% in 2020.
The average interest rate in this period is around 3.1%.
These interest rates are pretty low when you start going further back in time.
UK Interest Rates History – 50 Years
Let’s look over the last 50 years to see how interest rates have changed over time.
Right from the start of the 1970s all the way to the year 2000 the Bank of England interest rate didn’t drop below 5%.
In fact, it only dropped below 5% in 2001 and the last time before that was in early 1964.
Overall the average UK interest rate over the last 50 years from 1973 to 2023 is around 9.1%.
That’s a lot higher than what we’re seeing now.
Let’s break it down by decade now.
What Were UK Interest Rates In The 1970s?
In the 1970s the highest interest rate was 17% and the lowest interest rate was 5%.
What Were UK Interest Rates In The 1980s?
In the 1980s the highest interest rate was 17% and the lowest interest rate was 7.38%.
What Were UK Interest Rates In The 1990s?
In the 1990s the highest interest rate was 13.88% and the lowest interest rate was 5%.
What Were UK Interest Rates In The 2000s?
In the 2000s the highest interest rate was 6% and the lowest interest rate was 0.5%
What Were UK Interest Rates In The 2010s?
In the 2010s the highest interest rate was 0.75% and the lowest interest rate was 0.25%.
What Were UK Interest Rates In The 2020s?
In the 2020s (so far) the highest interest rate has been 5.25% and the lowest interest rate has been 0.10%.
Summary
I’ve put together this quick graphic that has a summary table of the highest and lowest UK bank rates from the 1970s to 2023 (the last 53 years).
")
UK Interest Rates History – 100 years
Over the last 100 years, we’d be looking at going back to 1923.
In this time frame, there have been over 300 Bank Rate changes and the average rate is around 8.3%.
What Was the Highest Interest Rates in the last 100 years?
In the last 100 years, the highest interest rate we’ve seen in the UK was 17% from November of 1979 to July of 1980.
This is actually the highest-ever interest rate for the UK, going all the way back to 1694.
Just to put this into perspective the difference between a 5% interest rate and a 17% interest rate is a 240% increase in interest payments.
In other words, an interest-only payment of £1000 on a £20,000 loan at a 5% interest rate would be £3400 at a 17% interest rate.
It’s more than triple.
- Related reading: Compare Interest Rates – Calculator
Why Were UK Interest Rates So High in 1979?
Interest rates were so high in 1979 because the Thatcher government of the time saw it as a way of bringing inflation down.
Inflation in the late 1970s was increasing with 8.3% inflation in 1978 and 13.39% inflation in 1979.
Lowest Interest Rate In Last 100 Years
The lowest bank rate in the last 100 years came in March 2020 at 0.10% (something else pretty big happened around this time too).
This was also the lowest-ever recorded bank rate for the UK.
The bank rate stayed at this record low of 0.10% from March 2020 to December 2021 before it increased back up to 0.25%.
Remember 0.10% interest is ten times cheaper than a 1% interest rate and 50 times cheaper than a 5% interest rate.
Going Back Further in Time to 1694
Before we get into the details let’s show you a graph that shows every historical interest rate change in the UK dating back to over 300 years ago.
Bank of England Base Rate History 1694-2023 Graph
Here’s a graph showing the UK interest rate history dating all the way back from October 1694 up to August 2023.
")
The graph can be a bit confusing because it just shows the date of the interest rate changes but doesn’t capture duration as well.
For example, the first dates shown on the x-axis are October 1694 and August 1847, that’s a difference of 155 years but on the graph, it doesn’t look like it.
What’s more, there were over 20 different interest rates in this period but it’s hard to see. What you can see is that between these two years, the interest rate stayed pretty close to 5%.
Don’t worry too much about the graph though, because we’ve gone into detail in the next few sections for each century to give you more of a breakdown for different periods of time.
1694- 1800 Interest Rates
When the Bank of England was first formed in 1964, interest rates were set at around 6%.
During this time there wasn’t actually an official bank rate, but these interest rates are the closest equivalent to what we would see as a bank rate today.
Here’s what the first few decades looked like:
- Changed to 4.5% in Jan 1965
- Changed to 3% in May 1695
- Changed to 4.5% in June 1699
- Changed to 4% in July 1716
- Changed to 5% in 1719
From 1719 to 1822 (that’s over 100 years), the equivalent of the bank rate never changed from 5%.
So from 1694 to 1800, the closest equivalent to the Bank rate was never more than 6% and never lower than 3%, but for most of that time, it was 5%.
1800s Interest Rates
In the 1800s, interest rates varied a bit more with the lowest rate being 2% and the highest rate being 10%.
However, for most of the 1800s, the bank rate hovered between 3% and 5%.
The 10% rate only occurred in the following brief periods in the 1800s:
- 12 November 1857 to 24 December 1857 (just over a month)
- 12 May 1866 to 16 August 1866 (just over a month)
Here’s a chart showing the UK interest rates in the 1800s. The graph starts at 1719 because the bank rate didn’t change again until 1822 (in the 1800s). It ends in the year 1900.
 historical interest rates (1)")
1900s Interest Rates
In the 1900s, the interest rates in the UK had a story of 2 halves.
The first half of the century had lower interest rates, and the second half of the century had higher interest rates.
In the time period from 1900 to 1950, the interest rate mainly hovered around 4%-5%, but from 1950 to 1999 the interest rate averaged closer to 10%.
In terms of the 1900s as a whole,
- The average interest rate is close to 7%-8%.
- The highest interest rate was 17% from November 1979 to July 1980.
- The lowest interest rate was 2%.
 historic interest rates (1)")
The bank rate had never been above 10% until July 1973, with the first time being in July 1973.
Before that, 10% was the maximum interest rate and was only in place 3 times:
- 12 Nov 1857 to 24 Dec 1857
- 12 May 1866 to 16 Aug 1866
- 01 Aug 1914 to 6 Aug 1914
How Often Are BoE Interest Rates Under 2%?
The first time that the Bank of England’s interest rate ever dropped below 2% was in January 2009 when it changed from 2% to 1.5%.
The next time the rate went over 2% was in September 2022 almost (13 years and 9 months later) when it went from 1.75% to 2.25%.
Since then it has never been below 2% as of September 2023.
So if we look back to around 1970 the Bank rate has only been below 2% interest rates for around 14 years out of 53 years. This is about 26% of the time.
And this is just for the Bank of England rate since 1975.
If we go all the way back to 1694 the Bank of England interest rate never went below 2% until January 2009.
So in the 329 years from 1694 to 2023, the official bank rate was only below 2% for 13 years and 9 months.
That works out to around 4% of the time period between 1694 and 2023.
So sub 2% interest rates aren’t actually that common in the grand scheme of things.
Different Names For The Official Bank Rate
The Bank of England official bank rate has had different names over the years including:
- Official Bank Rate current name (since 2006)
- Repo Rate – 1997 to 2006
- Minimum Band 1 Dealing Rate – 1981 to 1997
- Minimum Lending Rate 1972 to 1981
It is also called the BoE (Bank of England) base rate and the BoE base lending rate.
So if you hear any of these terms it’s basically talking about the same thing.
Further Reading
Working out payments based on interest rates includes maths.
Not everybody likes maths.
Luckily we’ve got a few easy interest rate calculators to help you with interest rate calculations.
Armed with the knowledge of this post, you can also do your own stress tests for buy-to-let properties.
If you’re interested you can also find out more about the history of the Bank of England: